
Modeling Working Capital: Idea Generation & Thesis Risk
Forecasting DSO, DIO, DPO: Classic False Mean Reversion Stock Example

You don’t need 5000-line models with 20 tabs to generate great ideas.
In fact, many PMs will tell you the key is an efficient, relatively simple model that captures changes in the business and its core drivers well. But sometimes you do need to be extra granular and thoughtful where it matters, both for idea generation and for accurately capturing the potential downside of an existing thesis.
Last time, we learned how to model and forecast the PP&E/capex/depreciation schedule in the context of hyperscalers’ AI infra buildout and more broadly in any heavy reinvestment cycle.
Modeling and forecasting working capital (WC) can be equally important, especially in retail, industrials, inventory-heavy cyclicals and any negative-WC businesses.
Introduction
As we already know, a large part of the idea generation process usually comes from the revenue build (access the excel and video walkthrough here), followed by the cost build:
How does the company grow revenue and profits over time? What does the cost structure look like? These are the two key questions when modeling revenue and margins. They help you identify the core revenue drivers (balancing granularity and researchability) and understand the cost components, including separating fixed versus variable costs.
There are all kinds of different investment and modeling philosophies here. Depending on coverage, some PMs would say that costs are what management has the most control over, so you are better off assuming consensus for revenue and spending the majority of your time talking to management and understanding margins. Others ask their analysts to focus almost exclusively on revenue.
But in a complete institutional-level model, you need both a detailed revenue build and a detailed cost build. Depending on the company, you may ALSO need detailed builds for working capital, depreciation, shareholders’ equity, debt schedules, etc. Note some models might also include separate tabs for revenue and gross/operating margin bridges that are helpful in understanding what caused changes in revenue or margins.
Model structure
There is no single widely accepted structure, but one approach is to have all three statements in one main tab: IS (income statement), BS (balance sheet) and CFS (cash flow statement). The revenue and cost builds sit in two separate tabs, with projections linked back to the main tab.
All these other schedules allow for more granular modeling of critical items and eventually link back to the main tab. For example, from the PP&E/capex/depreciation schedule we discussed last time, the projected depreciation expense goes to the IS (main tab), the projected PP&E goes to the BS (main tab) and the projected depreciation expense and capital expenditure go to the CFS (main tab). The main projected items from the working capital schedule go to the BS and the change in WC goes to the CFS.
In terms of the working capital schedule, you don’t always model it separately. In fact, many hedge fund models don’t have one at all, especially when WC is small, stable and not part of the thesis (though stable trend now doesn’t always imply stable trend in the future). In those cases, you can just project AR, inventory, AP directly on the BS in a simple way and let the CFS pick up the change in WC automatically.
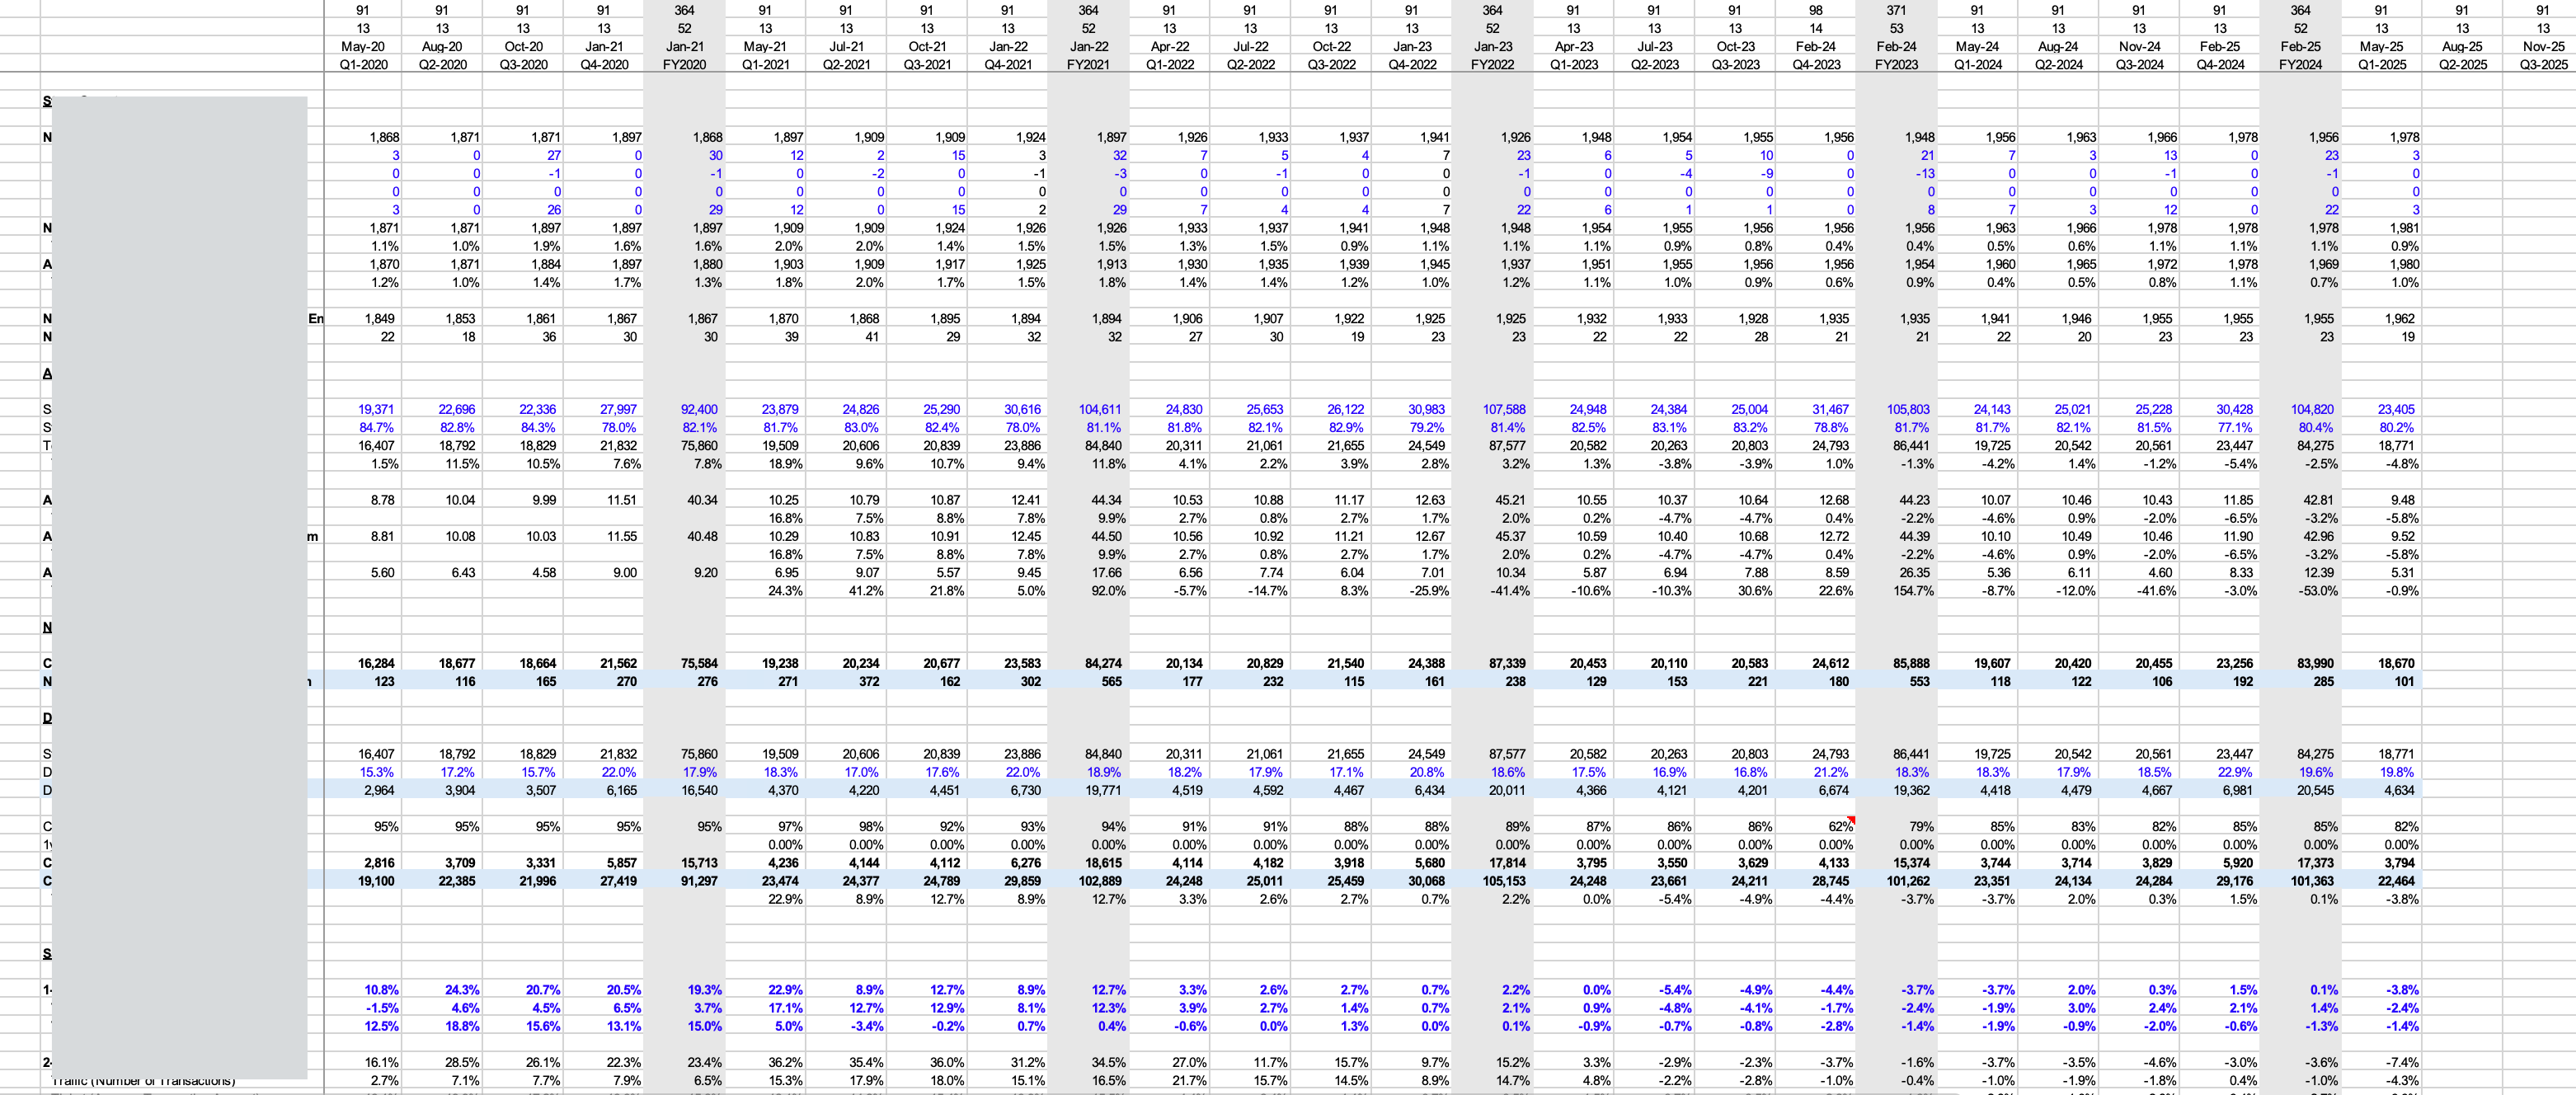
However, there are many cases where you absolutely need to thoughtfully break working capital down. Today, we cover the frameworks top analysts use to model and forecast the working capital schedule. We also go through one of the all-time classic retail shorts from 2022 that clearly shows why accurately forecasting working capital can be a powerful source of variant views, and why, fast-forward to today, it is still relevant to the core debates around the stock when assessing potential risk scenarios.